
Module 04 · 12 minutes
Probability Without Fear
Read probability, base rates, model confidence, and evidence without treating a prediction as a fact.
Written and edited by Cahyanto Arie Wibowo. Last reviewed · version 1.2.
Does an 80% probability mean the result is almost certainly true?
Not necessarily. An 80% probability expresses uncertainty under particular data, assumptions, and a model; it is not a promise about one event. Its meaning becomes useful only when we know the predicted event, the comparison group, the quality of evidence, and whether similar scores match real outcomes.

After this lesson
- Read a probability as a frequency across many comparable events.
- Distinguish probability, model confidence, and certainty.
- Combine base rate, error consequences, and other evidence before acting.
Start with a small decision
A 70% chance of rain does not tell you whether one drop will land on your head.
The number helps with a decision: bring an umbrella or leave it behind. But the decision also depends on the inconvenience of carrying one and the cost of getting wet. A five-minute walk may justify a different choice from carrying important documents across town.
Probability does not make the decision for us. It summarizes uncertainty under a particular information set and calculation. Our job is to understand what is being estimated, then combine it with cost, benefit, and tolerance for error.
See it as frequency
Turn a percentage into one hundred comparable events.
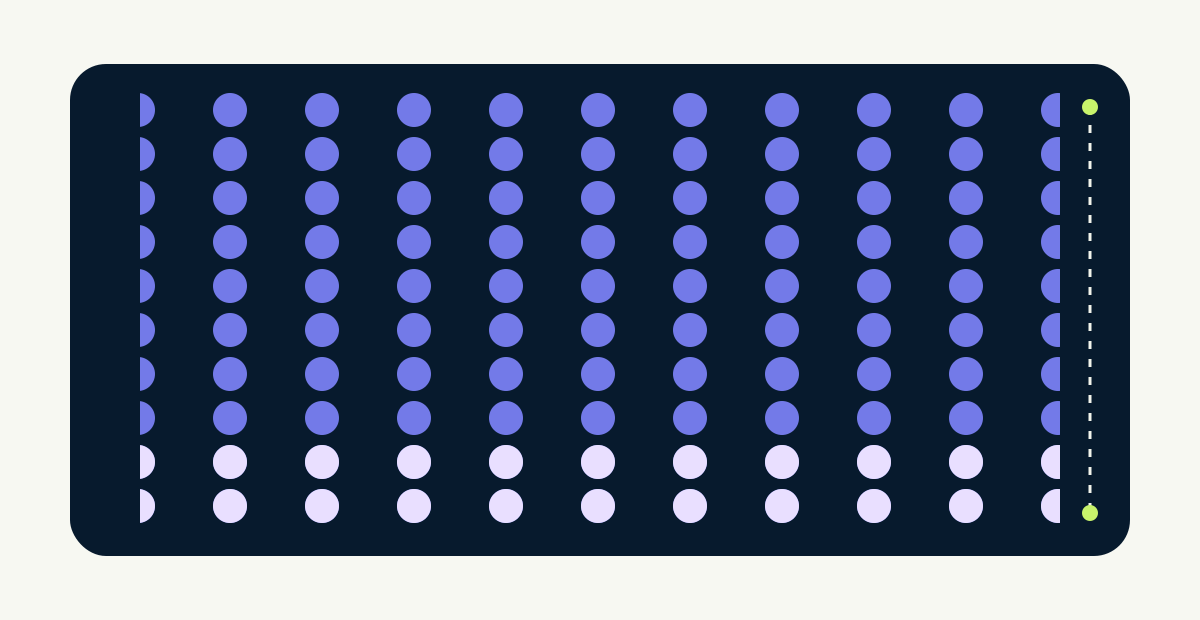
The grid contains 100 events. Eighty are marked as the expected event and twenty are not. This does not guarantee an order; the first event can still belong to the group of twenty.
Three key terms
Separate likelihood, model confidence, and certainty.
They are easily mixed because each may appear as a number or sound convincing.
- Probability
- A measure of how likely an event is under particular assumptions and information.
- Model confidence
- An internal score or model estimate. It may not equal the real-world chance of being correct.
- Certainty
- A state without doubt. It is rarely available in real-world prediction.
A small-number example
A system gives a transaction an 80% risk score. What should happen next?
Diketahui
- One transaction receives an 80% risk score.
- Blocking a legitimate transaction prevents a customer from paying.
- Missing a fraudulent transaction creates financial loss.
- 1. Read the number The score is a strong model signal, not proof that this transaction is fraudulent.
- 2. Find the comparison group Check whether transactions with similar scores are actually fraudulent about 80 out of 100 times. This tests calibration.
- 3. Check the base rate When fraud is rare, even an apparently accurate system can produce many false alerts.
- 4. Match the action Instead of immediate blocking, the team could request another verification or route the case to human review.
Hasil: The same score can justify different actions because false positives and false negatives carry different costs.
Interpretasi: Probability becomes useful when connected to model quality, the event base rate, and the consequences of action.
The number that often goes missing
A base rate tells us how common an event was before the new prediction.
Suppose only 1 out of 100 transactions is truly fraudulent. A system catches most fraud but also flags some normal transactions. Because normal transactions greatly outnumber fraud, false alerts can outnumber the fraud that is correctly identified.
That does not make the system useless. It means overall accuracy or one score cannot choose the action alone. A team needs precision, recall, a threshold, and the cost of each error type. You do not need every formula yet; remember that rare events require special attention to the comparison group.
Two different questions
A confident model is not necessarily calibrated.
High confidence
- The model gives a score far from its uncertain region.
- It describes certainty within the model representation.
- It can still be wrong because data changed or the model is overconfident.
Good calibration
- Among cases scored at 80%, about 80 out of 100 are correct in relevant data.
- It is tested on groups and periods resembling real use.
- It must be monitored when users, data, or process change.
Ask not only ‘what is the score?’ but also ‘have scores like this matched real frequencies?’
Reading trap
If probability is above 50%, we should always choose that outcome.
Why this can seem reasonable
A number above 50% feels like a majority and easily turns into an automatic decision rule.
How to check it
Action depends on impact. A 10% risk may be too high for a safety decision, while a 40% chance of success may justify a cheap, reversible experiment.
Pause and predict
Out of ten predictions scored at 90%, two are wrong. Is the model necessarily poor?
Form your answer, then reveal the discussion.
Reveal discussion
We cannot conclude that yet. Ten examples are too few for a stable calibration judgment. We need more comparable cases, need to know how they were selected, and should check whether errors concentrate in one group. The two errors still deserve review, especially when their impact is high.
Decision checklist
Before acting on a percentage, answer five questions.
- What event is actually being predicted?
- What group, period, or conditions form the comparison?
- How common was the event before this prediction? What is the base rate?
- What are the consequences of a false positive and a false negative?
- What evidence shows the score is calibrated for this context?
When a decision has high or irreversible impact, probability should be one piece of evidence among several, not the only trigger.
Quick practice
Choose a prediction you encounter, such as weather, risk, a lead score, or a recommendation. Record what its percentage means, the base rate you need, the two error types, and an action that remains safe if the prediction is wrong.
Summary
- Probability summarizes uncertainty under particular conditions; it is not a promise about one event.
- Read a percentage as a frequency among comparable events, then examine calibration.
- Good decisions combine probability, base rate, error impact, and human review.
Continue from here
- Base Rates and Evidence: Continue the idea from Uncertainty and Prediction with a closely related example.
- Golden Sets and Rubrics: Connect this lesson to Applied AI and test the idea in another context.
- Prompt Injection and Privacy: See how the same decision changes when viewed through Prompting.
Sources and further reading
- Introductory Statistics 2e: Probability Topics: OpenStax · open-textbook. Primary reference for the definition, evidence, or limits discussed in “Probability Without Fear”.
- NIST/SEMATECH e-Handbook of Statistical Methods: NIST · official-handbook. Further evidence and context for checking the explanation in “Probability Without Fear”.
- Classification: Accuracy, recall, precision, and related metrics: Google for Developers · official-course. Further evidence and context for checking the explanation in “Probability Without Fear”.